A Beginner’s Guide to Support and Resistance Lines
How to use support and resistance levels to time your trades.
Category
How to read candle charts and recognize buy and sell signals.
How to use support and resistance levels to time your trades.
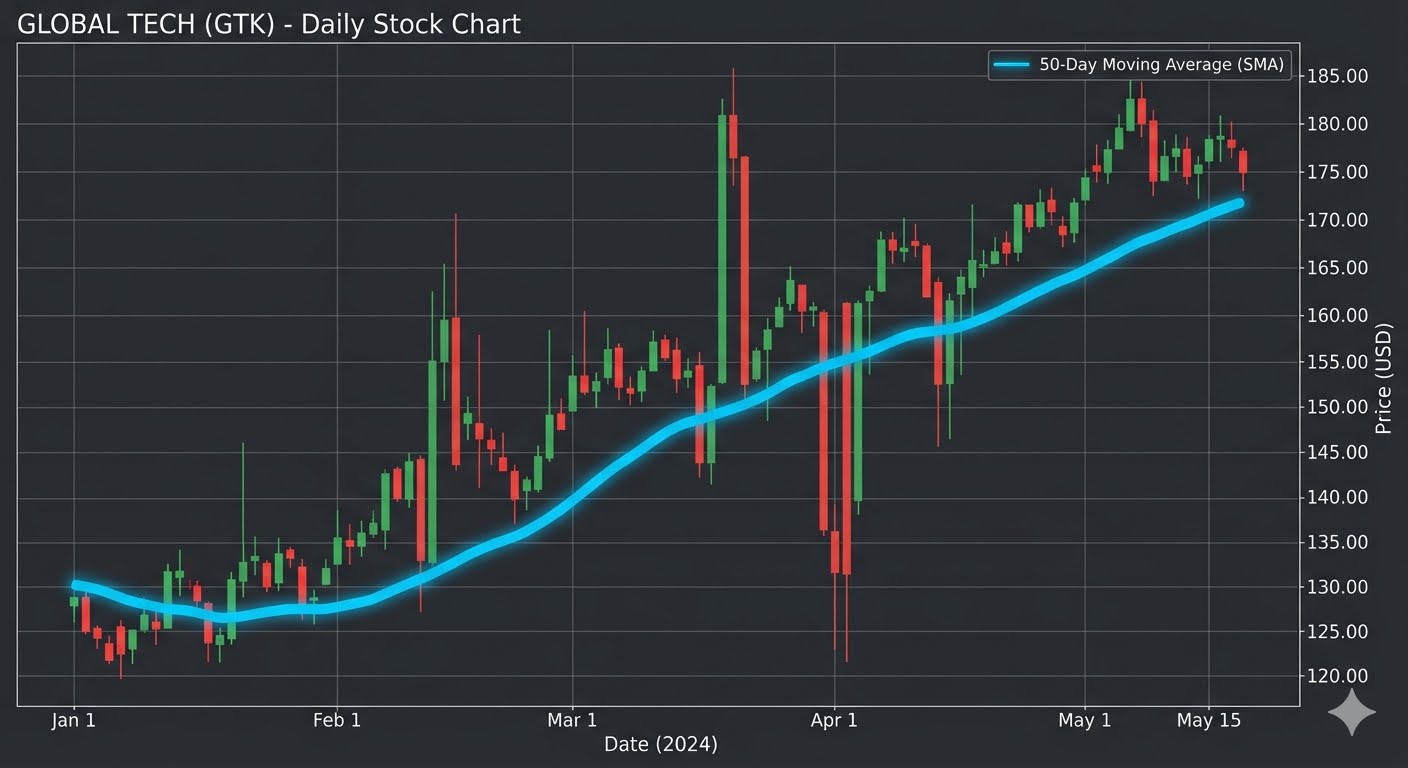
What the 50-day moving average can tell you about the momentum of stock.
Three ways that a moving average can be a valuable tool for traders and investors.
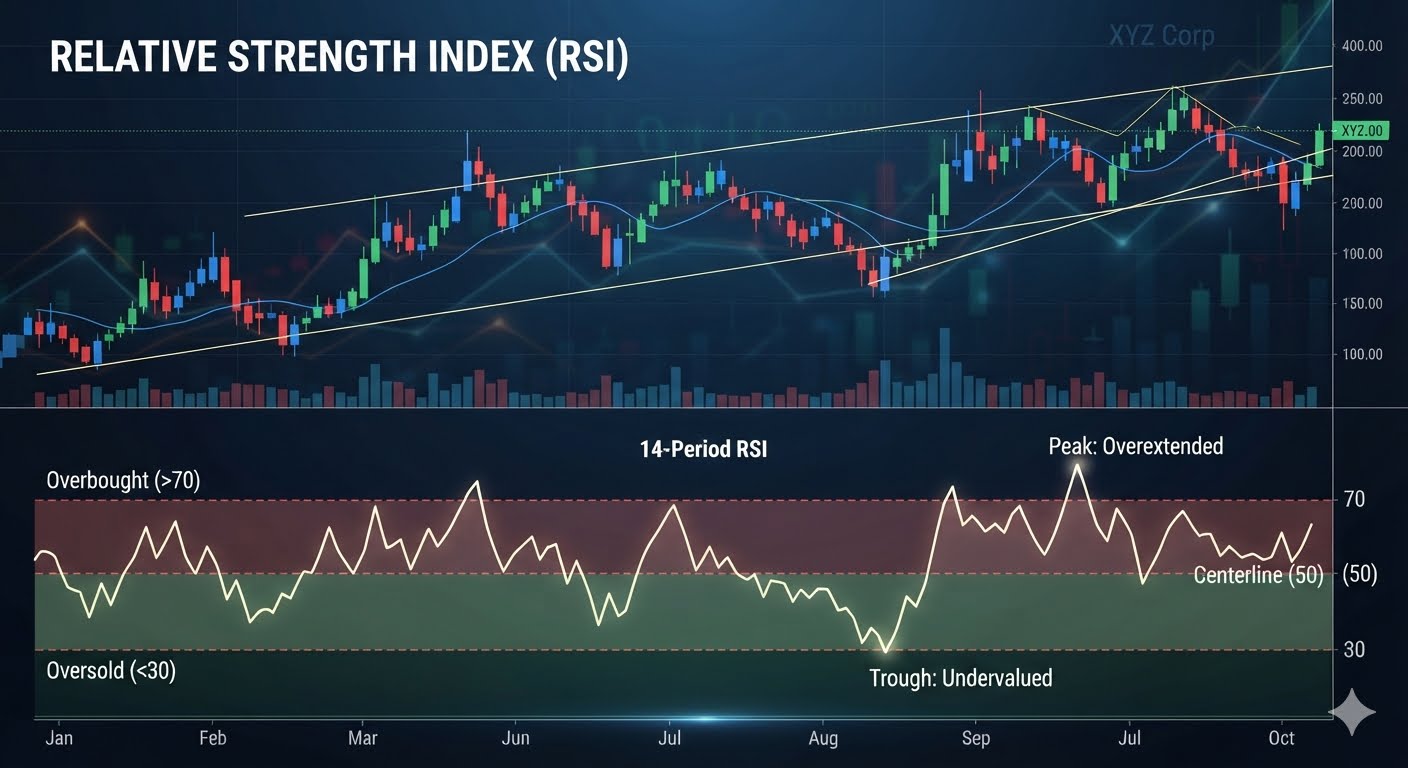
How to use RSI to determine if a stock is overbought or oversold.
What the chart looks like when a stock price is about to climb.
How to use green volume bars growing taller as a buy signal.
No articles found