What Are Moving Averages and How Are They Useful?
Three ways that a moving average can be a valuable tool for traders and investors.
What Are Moving Averages?
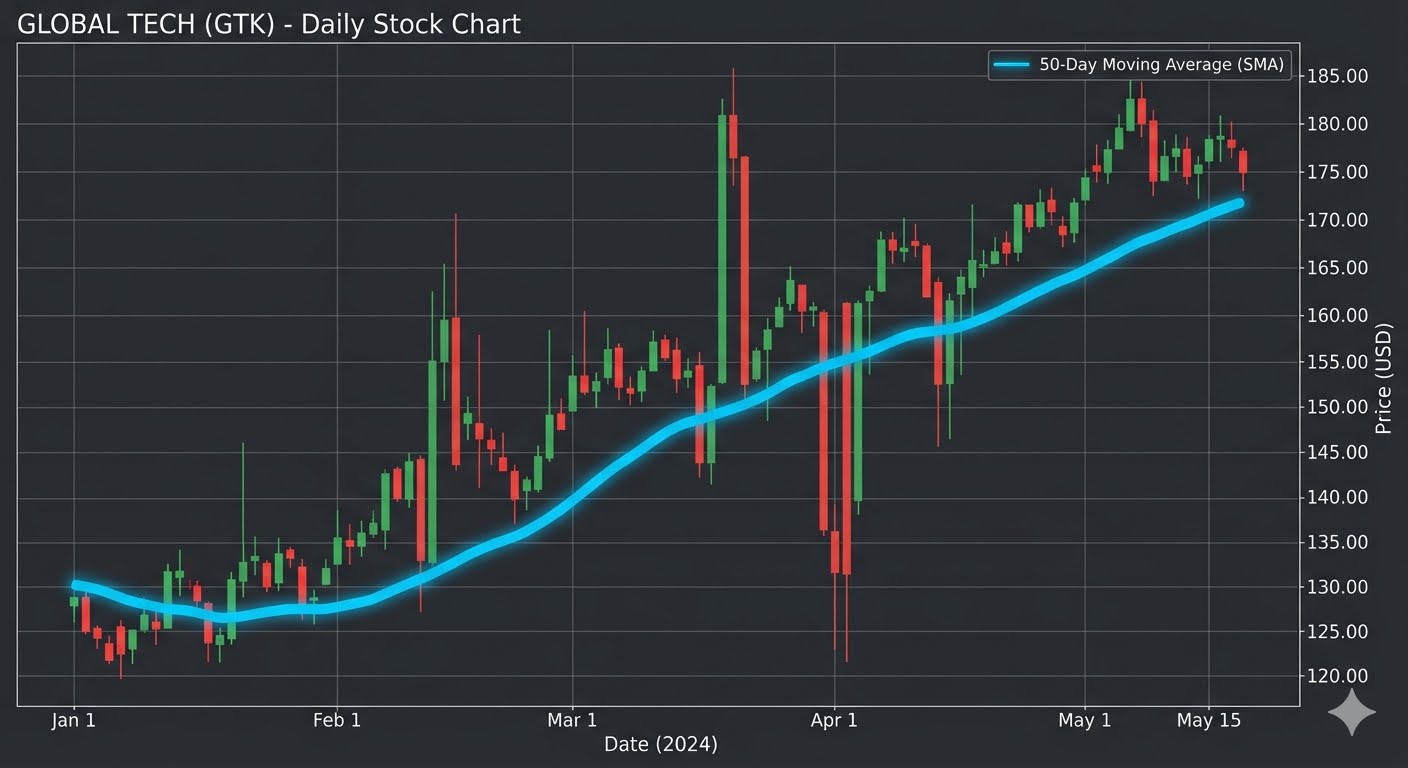
A moving average (MA) is a simple tool used in stock market technical analysis to help smooth out price data. Because stock prices go up and down every day, charts can look jagged and confusing. A moving average cuts through this daily "noise" by creating a single, flowing line that shows the average price of a stock over a specific period of time.
For example, a 50-day moving average adds up the closing prices of a stock over the last 10 days and divides that total by 50. As a new day of trading happens, the oldest day is dropped, and the newest day is added, which is why it is called a "moving" average.
How Are They Useful?
Moving averages are highly valuable to investors and traders for three main reasons:
- Identifying Trends: The most basic use of a moving average is to see which direction a stock is heading. If the moving average line is sloping upward, the stock is in an uptrend (prices are generally rising). If it slopes downward, it is in a downtrend (prices are generally falling).
- Finding Support and Resistance: Moving averages often act like invisible floors or ceilings for a stock's price. During a strong uptrend, a stock's price might dip but bounce right off its moving average line. In this case, the line acts as a "floor" (support). In a downtrend, the line can act as a "ceiling" (resistance) that the price struggles to break above.
- Spotting Potential Buy and Sell Signals: Traders often look at two different moving averages together—a short-term one (like a 50-day average) and a long-term one (like a 200-day average). When the short-term line crosses above the long-term line, it is called a Golden Cross, which suggests it might be a good time to buy. When it crosses below, it is called a Death Cross, indicating a potential time to sell.
Ultimately, moving averages help us look past daily market drama and focus on the bigger picture of where a stock is going.
Related articles

A Beginner’s Guide to Support and Resistance Lines
How to use support and resistance levels to time your trades.

Buy Signals Part 3 - Break Above the 50-Day Moving Average
What the 50-day moving average can tell you about the momentum of stock.
Understanding the RSI
How to use RSI to determine if a stock is overbought or oversold.