Buy Signals Part 3 - Break Above the 50-Day Moving Average
What the 50-day moving average can tell you about the momentum of stock.

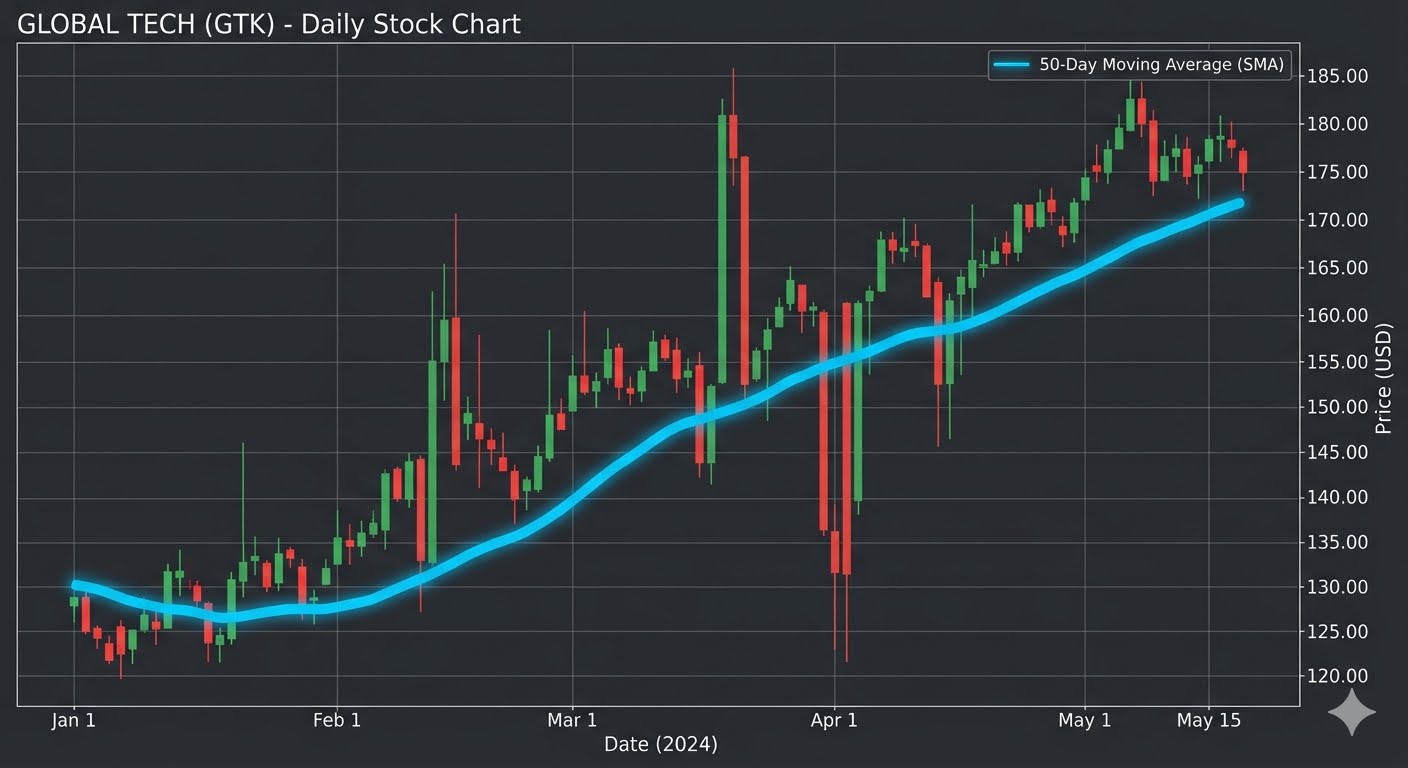
One of the first things I learned about when to buy a stock was to look for it to move above its 50-day moving average.
When you look at a stock chart, the price can look like a jagged mountain range, jumping up and down every day. To smooth out this background noise, investors use a tool called a moving average. A moving average is simply the average closing price of a stock over a specific number of days, drawn as a smooth line right on the chart.
Two of the most popular lines to watch are the 50-day and 150-day moving averages.
- The 50-day line shows the medium-term speed or "momentum" of the stock.
- The 150-day line shows the big picture, long-term health of the stock.
When a stock's current price breaks above its 50-day line, it is a sign that buyers are stepping in and taking control. This often acts like a green light for big professional investors, who start buying up more shares and pushing the price even higher.
However, buying a stock just because it crosses above the 50-day line can sometimes be a trap. If the stock is still in a long-term downward spiral, that little jump might just be temporary.
This is why checking the 150-day line is so important. If the stock is already trading above its 150-day line, it tells you that the big, long-term trend is pointing up.
When you buy a stock that breaks above its 50-day line while also staying above its 150-day line, you are getting the best of both worlds. You know that the short-term speed is picking up, and you know the long-term direction is safe and strong. It helps you avoid false alarms and ensures you are trading with the wind at your back.
Related articles

A Beginner’s Guide to Support and Resistance Lines
How to use support and resistance levels to time your trades.
What Are Moving Averages and How Are They Useful?
Three ways that a moving average can be a valuable tool for traders and investors.
Understanding the RSI
How to use RSI to determine if a stock is overbought or oversold.