Understanding the RSI
A Simple Guide for Everyday Investors
How to use RSI to determine if a stock is overbought or oversold.
What the Heck is the RSI?
The Relative Strength Index (RSI) is a popular technical analysis tool that can help investors understand the momentum behind a stock's price movement.
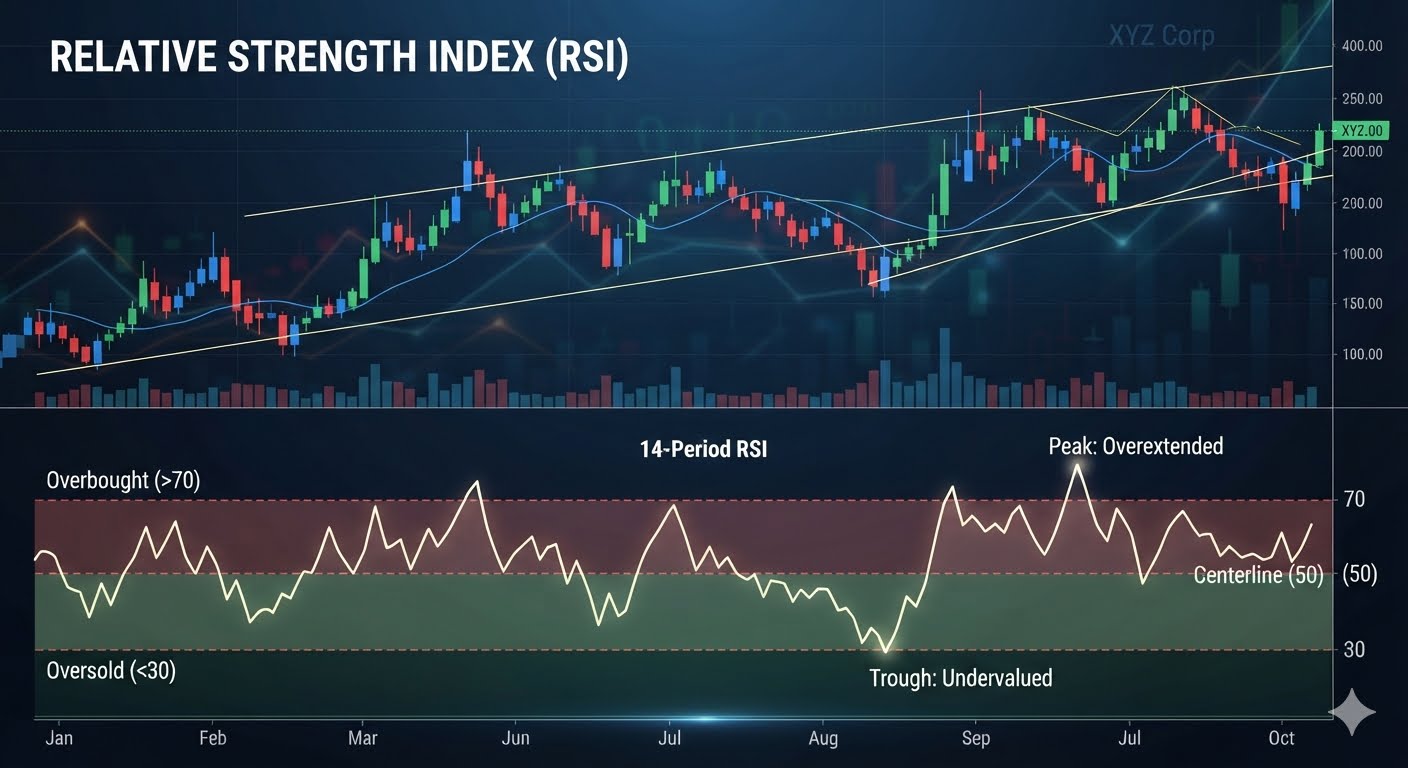
The RSI measures the speed and change of recent price movements and ranges from 0 to 100. Investors commonly use it to identify whether a stock may be overbought or oversold.
While the RSI should not be used by itself to make an investment decision, it can provide useful information when evaluating potential entries, exits, and risk.
RSI Above 70: Overbought
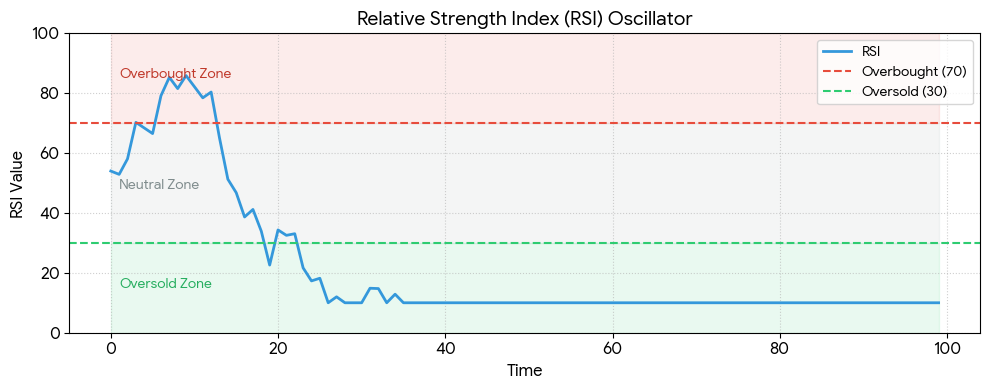
An RSI above 70 is generally considered an overbought condition.
This suggests that a stock has risen significantly and may have moved too far, too quickly. When this happens, the stock may be more vulnerable to a price correction or trend reversal.
An RSI above 70 isn't necessarily a signal to sell. Instead, it can serve as a caution signal.
It may also help investors avoid chasing a stock after a large price increase.
RSI Below 30: Oversold
At the other end of the scale, an RSI below 30 is generally considered an oversold condition.
This indicates that a stock has experienced significant selling pressure and may be due for a relief rally or price rebound.
Again, an RSI below 30 doesn't automatically mean a stock is a bargain or that its price will rise. It is better viewed as a buy or watch signal that encourages investors to take a closer look.
The 50 Level: A Trend Indicator
Some traders also pay attention to the 50 level on the RSI.
When the RSI crosses above 50, it can suggest that bullish momentum is beginning to build. When it falls below 50, it may indicate that bearish momentum is taking over.
The 50 level can therefore provide another way to evaluate the direction of a stock's momentum.
Using RSI for Risk Management
One of the most useful applications of the RSI is helping with risk management.
When a stock has an RSI above 70, investors may want to be more cautious about entering a new position. Buying after a stock has already become overextended can increase the risk of getting caught in a pullback.
Recognizing overbought conditions can also help investors consider tighter stop-loss levels or taking profits before a potential major correction.
Likewise, an RSI below 30 can help identify stocks that may deserve further research after a significant decline.
Conclusion
The RSI is a relatively simple indicator, but it can provide valuable information about a stock's momentum.
An RSI above 70 can warn that a stock may be overextended. An RSI below 30 can indicate that a stock may be oversold. And the 50 level can help investors evaluate whether bullish or bearish momentum may be developing.
The key is not to treat these levels as automatic buy or sell signals. Instead, the RSI can be another tool in an investor's toolbox—helping with timing, decision-making, and risk management.
Related articles

A Beginner’s Guide to Support and Resistance Lines
How to use support and resistance levels to time your trades.

Buy Signals Part 3 - Break Above the 50-Day Moving Average
What the 50-day moving average can tell you about the momentum of stock.
What Are Moving Averages and How Are They Useful?
Three ways that a moving average can be a valuable tool for traders and investors.