Knowing When to Sell: Using the 50-Day and 150-Day Lines to Protect Profits and Limit Losses
How to use moving averages as risk management tools.
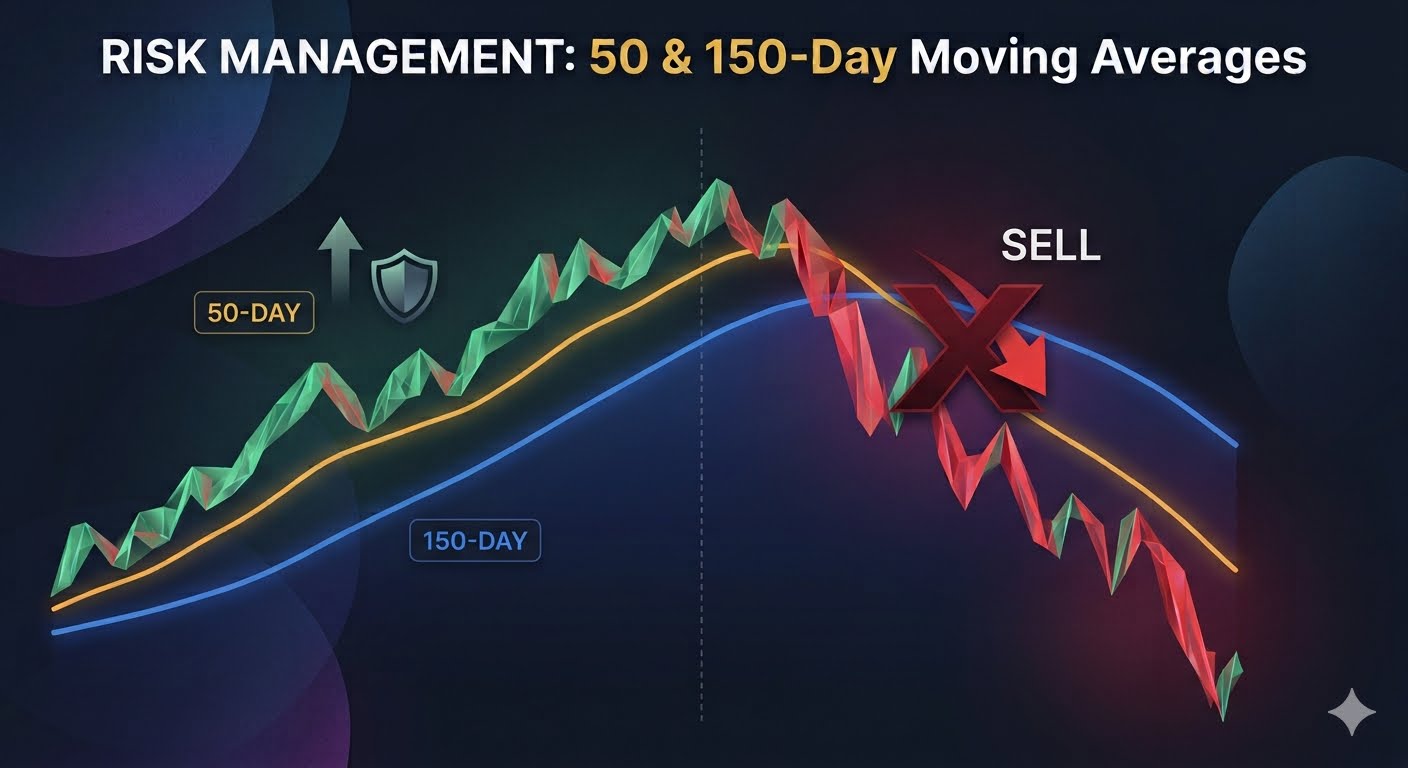
One of the biggest lessons I’ve learned from the Goat Academy is that knowing when to exit a position is just as important - if not more important - than knowing when to buy. Holding onto a falling asset out of hope can lead to severe portfolio damage. To remove the guesswork and emotion from selling, I was taught to use moving averages as an objective method for determining when it’s time to exit a position.
Two of the most widely used trendlines for risk management are the 50-day and 150-day moving averages. Depending on your strategy and time horizon, crossing below these lines provides an objective, mathematical signal to protect your capital. You can add moving average lines to candle charts using most charting software.
For Traders: The 50-Day Line as a Momentum Alert
Short-to-medium-term traders depend on upward momentum to make a profit. The 50-day moving average tracks medium-term price speed. In a healthy uptrend, a stock will usually stay above this line, bouncing off it during normal, minor pullbacks.
When a stock's price decisively dips below the 50-day line, it is a clear warning sign. It indicates that near-term buying momentum has vanished and sellers are taking control. For traders, selling immediately when this breakdown happens can prevent a minor loss from turning into a severe decline. It allows them to protect their trading cash and reallocate it to stocks that are actually moving higher.
For Investors: The 150-Day Line for Long-Term Safety
Long-term investors expect short-term market volatility and ignore daily noise. Because of this, the 50-day line is too sensitive for them. Instead, investors usually monitor the 150-day moving average, which tracks the big-picture, long-term health of an asset.
When a stock slides below its 150-day line, it is no longer undergoing a temporary, healthy correction. Instead, the stock could be entering a major downward cycle. Falling below this macro trendline may mean the company's long-term growth trajectory has broken down. For an investor, this cross serves as an emergency exit signal, letting them lock in remaining profits or cap their downside before massive long-term equity destruction takes place.
Ultimately, choosing your exit point based on your specific time horizon ensures you stay disciplined, protect your investment, and keep the mathematical odds on your side.
Related articles

What I Learned About Earnings Reports
How to manage the risk of holding stocks through earnings reports when prices can become extremely volatile.

Beyond the Hype: What SpaceX Can Teach Us About the Risks of Buying an IPO
Why everyday investors lost money on the SpaceX IPO.

Position Sizing: Another Powerful Risk Management Tool
Why knowing how much to buy and how much you are willing to lose may be one of the most important skills for surviving in the stock market.